Statistical anomalies in the 2020 Presidential Election
A good friend is a forensic investigative accountant after serving for a time on the NZ Police Fraud Squad. She specialises in detecting corporate fraud for a variety of private sector companies (often insurance companies) in various countries. She once said the beauty about her profession is that the data cannot lie, and that forensic analysis of statistical records can unearth various anomalies that become the pointers to provable fraud. As the Trump campaign seeks to overturn results in key states alleging various types of electoral fraud as covered in my last post, today I will focus exclusively on statistical anomalies in the 2020 Presidential race that at the very least raise questions and likely point to targeted election fraud.
1 – Incumbent loss anomaly. Donald Trump is the first incumbent President in 132 years since Grover Cleveland’s failed bid for re-election in 1888 to have increased his vote from his initial election and seemingly to still not win re-election. Whilst the Nixon and Reagan re-election landslides of 1972 and 1984 dwarf Trump’s 10 million increase in the popular vote since 2016, nonetheless an increase of a similar size was enough for George Bush to be reasonably comfortably re-elected in 2004.
2 – House of Representative results anomaly. The party whose candidate wins a Presidential election normally increases its representation in the House of Representatives thanks to the campaign momentum of the winning candidate at the top of the ticket. I’ve analysed the net House seat gains in each Presidential election since 1964 and the party winning the Presidency gains on average of net 16 House seats. Biden appears at this stage to be the 2020 winner however the Democrats are on track to lose a net of 12 House seats. This is a swing of -28 seats from the norm which is a huge statistical anomaly because normally a winning Presidential candidate has down ballot coattails that benefit House candidates for their party. This did not happen for Biden in 2020.
3 – Senate results anomaly. Anomalies even extend to the Senate where voting swings are less pronounced than the House due to the 6 year term and only 33% of Senate seats being up for re-election in a given Presidential election. Because so many Senate races involve incumbents who fundraise and campaign aggressively in addition to their party’s candidate at the top of the ticket, on average the number of votes cast for a Senate candidate of a party is more than the votes cast for the winning Presidential candidate of the same party. I have analysed the Senate voting patterns for 17 swing states since 1964 concentrating on the Senate races in states where the candidate for Senate is in the same party as the WINNING candidate for President. The numbers of races caught in this analysis ranges between 6 and 9 races per each Presidential election. The average vote differential between the Senate candidate and the winning Presidential candidate of the same party is 4.4% more votes for the Senate candidate over the Presidential candidate. The 2020 election bucks this trend with votes for Biden in the swing states exceeding his own party’s senate candidates votes by on average 2.5% (provisional results only of course). This is a statistically significant 7% swing which may not sound much but given Biden holds leads of 1% or less in four states (AZ, GA, WI, and PA), this differential is consequential. In Georgia, Biden polled 99,000 more votes than the Democrat Senate candidate in the normal two candidate Senate race in GA (a second Special Senate election was held for the other GA senate seat but it was a three way race). Sidney Powell (a Trump lawyer) estimates that, of those 99,000 excess Biden votes in GA, there were 65,000 votes solely for Biden and no other votes for any other candidate anywhere on the ballot. Biden’s current lead in GA is only 12,000.
SOURCE: All the election results were taken from Wikipedia which, for this subject matter, is very reliable. The spreadsheet I have made is too big and complex to post but is available upon request – indicate in the comments and I will find a way via David to get it to any interested party.
4 – Swing state anomalies versus Obama’s very strong 2008 performance. Biden’s leads in swing states are uneven and the difference seems to be who is in control of the voting procedures at the state level. Trump won comfortably in Florida, Ohio, Indiana, South Carolina and Iowa and his leads in those states were barely dented overnight by the significant vote shifts in favour of Biden that occurred in the 11 other swing states Biden appears to have won. Trump had sizable leads overturned in Georgia, Pennsylvania, Michigan, Wisconsin, and Arizona and then, in states like Virginia, Colorado, Minnesota, Nevada, and New Hampshire where he was surprisingly close on election night, only to see it dramatically slip far away. Only in North Carolina did Trump cling on to a lead and go on to win despite the added Biden votes. I compared the Biden vote in all these swing states with the 2008 vote for Obama. The Obama 2008 vote has been adjusted for population to make for a more apples v apples comparison to reflect the 8.7% increase in the US total population since 2008. In the 11 swing states that saw late surges in Biden votes, Biden increased his vote over Obama’s adjusted 2008 vote by 2.6 million or 13% whereas in the other 5 states, Biden’s vote compared to Obama’s 2008 adjusted vote was down 667,000 or -5%. This is an almost 20% variance between battleground states, a result all the more remarkable given Obama clearly ran a powerful populist campaign barnstorming the country in 2008 with huge attendance at massive rallies with a palpable enthusiasm to elect a young charismatic first black President whereas Biden is a geriatric quintessential Washington insider with obvious cognitive impairment who ran a lackluster campaign with few appearances that were poorly attended. Trump’s campaign was the one with all the energy and enthusiasm that more closely matched Obama’s winning 2008 campaign and yet Biden managed to juice Obama’s big 2008 vote by 15% …. but only in just the right states! It defies belief. And why do you think that his vote versus Obama was down in the other 5 swing states (in almost all cases he was even down on Clinton’s vote)? Voter integrity laws and procedures in these Republican run states are more robust thus forcing even Democrat run counties to follow stricter balloting procedures. But you say what about Georgia with a GOP Governor and Secretary of State. Well, the Republican Governor Brian Kemp beat Stacy Abrahams by 50,000 votes in 2018 and she alleged voter suppression and never conceded and in order to appease her, Kemp and Secretary of State Brad Raffensperger entered into a procedural Consent Decree that relaxed the Georgia absentee ballot rules for 2020 and made the auditing process in a recount so complex as to render an audit to be little more than a standard recount which is why the Georgia recount is now the subject of various lawsuits as it is not a full audit because it has no signature reconciliation component as Kemp and Raffensperger negotiated that away.
5 – Bellwether county anomaly. All western first world democratic countries have bellwether districts that election prognosticators look to during result counting as they have gone with the winning party in many elections. In the First Past the Post days in NZ it was the electorate of Eden in Auckland, in Australia it is still the electorate of Eden-Monaro in NSW south of Sydney. The UK has the bellwether constituency of Dartford in Kent and in Canada, the riding of Cambridge, Ontario is one of their bellwethers. In the US, because votes are almost always administered and counted at the county level, two counties have emerged as reliable harbingers of the winner Presidential candidate. They are Vigo County in Indiana encompassing the town of Terra Haute and Valencia County in New Mexico just south of Albuquerque. Vigo County has picked the winning President in every election since 1956 AND has only missed twice since 1896! Valencia County’s winning streak extends to Eisenhower’s first victory in 1952. And yet strangely Trump won Vigo County in 2020 by a comfortable 56/41 margin or 15 points and he won Valencia County a slightly smaller 10 point margin 54/44!
6 – Thousands of precincts all reporting significant over vote in Michigan. Russell Ramsland of Allied Security Group, LLC of Dallas, TX swore an affidavit concerning a detailed audit his company did on voting machines in Texas in 2018. He wrote in detail of the many serious security inadequacies of the software and then examined the 2020 Presidential vote count in a number of counties in Michigan. He reported that over 3,000 precincts in the state of Michigan reported a vote count between 80 and 350% of registered voters. He lists a number of precincts in his report and in some cases a massive over vote. The vast majority of the precincts on the list were on or about 100%. The whole affidavit makes for interesting reading.

7 = Biden underperforms Obama in 80% of Wisconsin counties but hugely overperforms in just 5 counties. This anomaly was actually covered in my post last week but this time I have put what happened to the Biden vote in table form:

The 5 counties with the disproportionate vote for Biden encompass in order, north west of Milwaukee, outskirts of Minneapolis MN, Madison (a liberal college town and the state capital), eastern suburbs of Milwaukee and northern suburbs of Milwaukee. Obama’s and Clinton’s votes are distributed along historical Democrat strength patterns as was Trump’s vote for Republican areas in 2016 and 2020. Biden’s vote is well down across almost all the state and massively even unnaturally up in a few key urban strongholds.
8 = Wayne County, Michigan anomaly. On Tuesday attempts were made to certify the vote in Democrat heavy Wayne County in which Detroit Michigan sits. Initially the decision was deadlocked 2 -2 but after various online attacks, doxxing and threats on a Zoom call the two Republicans on the County Elections Board caved and certified. They have since reversed their decision and filed affidavits alleged intimidation and bullying tactics. One of the Democrats on the Board in his rant on Twitter to heavy his colleagues, uttered some inadvertent but important truths that shed light on yet another anomaly, that of the fact that in fully 71% of precincts in the county, the tally of absentee ballot of those who requested ballots and those who cast ballots was unable to be reconciled because the number of actual absentee ballots counted exceeded the number legally requested. Furthermore, 28% of ballots could not be verified because they have either been lost or destroyed! There is no doubt that Biden would carry a county like this but for the sake of voter integrity, election officials ought not certify until all ballots can be properly reconciled.
9 = Anomaly of hugely lopsided Biden votes added in minutes in the dead of night. This statistical anomaly was picked up in real time by an analyst awake in Switzerland at around 3am Central Standard Time (CST) of the morning of November 4th watching the results coming in for Wisconsin. He noticed Fox News’ election map of Wisconsin went from light red for Trump with a 77% likelihood for Trump to light blue for Biden with an 80% for Biden IN THE SPACE OF MERE MINUTES. He got suspicious of such a massive switch in such a short period of time and so he went to the New York Times minute by minute electronic update from the raw data feed supplied by Edmonds Polling of reported election results and observed this:
“For non-programmers, here is the translation:
At 3:37 AM CST, total votes were 3,018,212; Trump had 1,536,270 votes (50.9%); Biden 1,427,614 votes (47.3%); other candidates 54,328 votes (1.8%).
At 3:42 AM CST, total votes were 3,186,598; Trump had 1,561,433 votes (49.0%); Biden 1,570,993 votes (49.3%); other candidates 54,172 votes (1.7%).
Total increase in Trump votes in 5 minutes: 25,163 (1.64%).
Total increase in Biden votes in 5 minutes: 143,379 (10.04%).
Before the Biden vote dump, both candidates’ votes were increasing at about the same rate, 1.64% per 5 minutes. So, the “legitimate” Biden vote increase is likely around 23,400 votes. The remaining 119,979 votes are fake.
Here is his analysis of the same trend in Michigan
“At 5:32 AM CST on November 4, total votes were 4,574,555; Trump had 2,346,747 votes (51.3%); Biden 2,150,041 votes (47.0%); other candidates 77,767 votes (1.7%).
Then, still at 5:32 AM CST, only five seconds later than the prior reading, total votes were 4,724,327; Trump had 2,352,715 votes (49.8%); Biden 2,291,299 votes (48.5%); other candidates 80,313 votes (1.7%). In that brief five-second period, Trump’s vote total increased by 5,968 (0.25%) while Biden’s vote total increased by 141,258 (6.57%)! Folks, that is a clear, fraudulent electronic “ballot dump” for Biden. I calculate that this fraud created about 135,883 fake votes for Basement Joe.
The count kept uneventfully grinding on to 6 AM CST, where at 6:03 AM total votes were 4,752,966, Trump votes were 2,366,977 (49.8%), Biden votes were 2,309,941 (48.6%). Ballots (presumably real paper ballots) had been counted at the rate of about 1,000 ballots per minute for the preceding half-hour, with Trump votes having a slight edge over Biden votes during the counting.
Then between 6:03 and 6:14 AM CST, more than 113,000 “votes” were counted, at an average rate of 9,800 ballots per minute. Total votes increased sharply to 4,866,279. Trump votes were 2,403,942 (49.6%), an increase of 36,965 votes (8.16% increase). Biden votes were 2,379,610 (48.9%), an increase of 69,699 votes (30.17% increase). Unlike the previous half-hour of counting, this deluge produced almost two Biden votes for every Trump vote counted.
Of those 113K total votes, 40K showed up in the last two minutes – between 6:12 and 6:14 AM. In two minutes, Trump gained 5,665 votes; Biden gained 29,588 votes. That’s about 5.2 Biden votes for every Trump vote. Because paper ballots simply cannot be fed into the ballot boxes that quickly, I consider this interval to also be electronic vote fraud, adding about 24,037 fake votes to Biden.
Then the ballot-counting quieted down and returned to “normal,” with votes for Trump and Biden about equal, until just before 8 AM, when another sudden burst of 107,700 heavily-Biden votes – 41,914 for Trump, 65,786 for Biden – erased Trump’s lead and tied the candidates at 49.2% each of the total votes. My total count for electronic fraudulent Biden ballots from this 2-hour, 30-minute period is 159,920”
10 – Anomalous turnouts in Wisconsin and Minnesota

Minnesota’s turnout average for the last 3 elections was 76% and in 2020 it was a full 13% higher. In Wisconsin, the average was 71% last 3 elections, so the 2020 increase was a whopping 18%. The 2020 turnout percentages in WI and MN are fully 9% higher than NZ’s highest turnout election in the last 5 (2017) and is only 3% lower than the average 92% rate in Australia that has compulsory voting! But perhaps the most telling comparison is with the GOP controlled battleground states that went for Trump and where no anomalies have arisen. Florida averaged 74% last 3 elections and at 75% in 2020 was only 1% higher. Ohio averaged 65% and in 2020 was 67% so only 2% higher. The average increase in turnout across PA, WI and MN was 14% and the average for FL and OH was 1.5% or a 9 times higher turnout average. Are there any statisticians out there that can calculate the odds of this huge voter turnout in these key swing states being a natural and normal trend?
Data for Florida is from here, 2020 turnout here, historical turnouts here and Pennsylvania here:
11 – Pennsylvania’s mail in ballot anomaly. Democrats will say that Trump lost Pennsylvania because the mail in ballots went so heavily to Biden. Trump won in-person voting in PA 70/30 and had a 900,000 vote lead on election night but as the night wore on and mail in ballots were counted, his lead was whittled away and over the next week, he ended up being 40,000 votes behind. The trouble is that when you look at the margin that Biden beat Trump in the mail in ballots broken down by each county, the margin at which Biden won was at or around 40% in each county. That defies logic in that Biden would be expected to lead Trump strongly in the Democrat stronghold counties and lead less strongly or trail Trump in the Republican stronghold counties, much as was the pattern with the in-person voting on election day. This result is statistically impossible and has never been replicated anywhere. As an examination of another state’s mail in ballot ratio, the authors took Arkansas as a state that is not a battleground state. In that state, you see fluctuations of the Trump-Biden mail in ballot count from a 2% Biden lead to a 40% Biden lead depending on the demographics of the county and the overall average was a 25% lead. There is no denying Biden did stronger with those mailing in ballots but a 40% lead in rural Pennsylvania is unheard of as is the uniform identical lead across EVERY COUNTY!


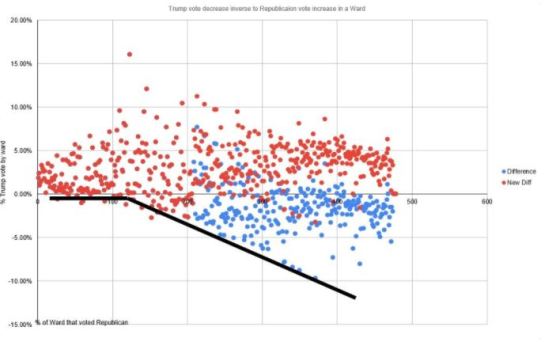
12 – Michigan counties anomalies. MIT PhD engineer Dr. Shiva Ayyaddurai, did an interesting analysis of the Biden Trump split in 3 Michigan counties. He plotted the margin of victory of Trump over Biden on the x axis across precincts on the Y axis with the precincts ranked from left to right by the strength of the historical generic Republican vote weakest to strongest. When he did the analysis in Macomb County Michigan he saw that in the strongest Democrat precincts, the pattern remains the same but as the precincts became stronger and stronger for Republicans, the vote margin between Trump and Biden INCREASES in a direct linear line and this curious statistical anomaly happened identically for the election day vote and the early vote – the trend line is illustrated by the orange lines. The exact same trend line was observed in Kent and Oakland Counties (only McComb is shown but the others are virtually identical), again identical for election day and early voting. No real vote turns out like this smooth and linear in its progression nor would you expect a margin of Biden over Trump to get bigger the more conservative the precinct and so he hypothesises that a vote switching algorithm is the only logical way to explain such a statistical anomaly.

13 = Same anomaly occurs in Wisconsin. Using Dr Ayyaduria’s analytical technique, a Gateway Pundit data analyst compared Dane County results which have the same flat line and normal distribution

and yet 20 miles away in Milwaukee County, the same anomalous trend line found in some Michigan counties are found there.
14 – Virginia has similar ballot count anomalies. Virginia is another state that electronically posted ballot counts through the night of November 3rd which this analysis shows that batch after batch in a perfect 55/45 Biden/Trump split. No large series of separate mail in ballot batches would end up with identical partisan splits time and time again. The statistical likelihood is astronomical. One statistician said it was like Biden winning a coin toss 100 times in a row! Once again, the only logical conclusion is that the count must have been manipulated.


15 = Mail in ballot rejection rates in 2020 defy historical norms. Mail in ballots have been a feature of the US political landscape in various states for a number of election cycles. For obvious reasons they are subject to some rejection as voters fail to validate the ballot with a signature on the envelope or the signature submitted does not reflect the signature held on file at the time of registration. In 2016, mail in ballot rejection rates were around on average 1% and in some states as high as 6%. In Georgia they were over 6% in 2016 and yet an unbelievably small 0.2% in 2020. During the 2020 primary season, being the first voting to take place after some states switched to the mass mailing of ballots to ALL voters on the roll as opposed to posting only to voters who specifically requested a mail in ballot. In New York state during their primary in June this year, a whopping 20% of mail in ballots were rejected primarily because of the confusion and errors in sending ballots to not fully accurate voter rolls. Thus, it came as a big surprise to observers to see the rejection rate of mail in ballots in the swing states that Trump appears to have lost to have minute rejection rates of 0.3%. This flies in the face of the statistical experience of prior Presidential elections and the chaos seen only months ago with mass mail in ballots being sent during the spring/summer primary elections. A partial explanation is that the cure rate of flawed ballots is higher but that is because state and county courts have arbitrarily expanded the time allowed to cure defective mail in ballots from the usual statutory 3 days to as long as 8 additional days without any amendment of the relevant statutes by state legislatures who alone are tasked in the US Constitution with the job of setting election rules. This issue is the subject of some of the Trump campaign lawsuits.
CONCLUSION. These various statistical patterns raise some serious concerns. The current uncertified election results sees a seemingly defeated Donald Trump defy a number of statistical conventions going back many decades over dozens of Presidential elections. The various anomalies unearthed by various people point to irregularities in the vote that should be investigated and litigated to the highest level possible to ensure widespread integrity in the voting system. Many criticise the Trump team for their efforts and yet ask yourself this, were the roles reversed we all know the Democrats would litigate and demand full examination of any and all irregularities and I would support them in that quest, again so that people of all political persuasions can know that elections in the US are fair and accurate. If all these investigations and lawsuits unearth anomalies that are insufficient to reverse any of the leads Biden currently holds in key states, counter to the fevered speculations of some of the left, I believe Trump will concede and do so with grace. But if the allegations made (and there are very many I have not gone over in my two posts including those made at the explosive press conference yesterday) are true, then we have the most existential political crisis the US has faced probably since the Civil War and the possible remedies and outcomes thereafter do not bear thinking about.